Crime Stats
NOCUPP Program Statistics
2007 | 2008 | 2009 | 2010 | 2011 | 2012 | 2013 | 2014 | 2015 | 2016 | 2017 | Totals | |
---|---|---|---|---|---|---|---|---|---|---|---|---|
As of May 2017 | ||||||||||||
Calls for Service | 46 | 870 | 901 | 1141 | 1281 | 1342 | 1048 | 1089 | 1089 | 853 | 164 | 9,824 |
Vacation Watches | 180 | 1236 | 1021 | 2059 | 2634 | 3520 | 3220 | 6353 | 4716 | 5039 | 1192 | 31,170 |
Traffic Stops | 69 | 606 | 475 | 538 | 357 | 486 | 381 | 251 | 197 | 112 | 17 | 3,489 |
Pedestrian Stops | 125 | 23 | 148 | |||||||||
Citations | 25 | 209 | 141 | 220 | 180 | 228 | 145 | 112 | 29 | 32 | 1,321 | |
Arrests | 8 | 115 | 91 | 141 | 115 | 126 | 79 | 51 | 25 | 18 | 1 | 770 |

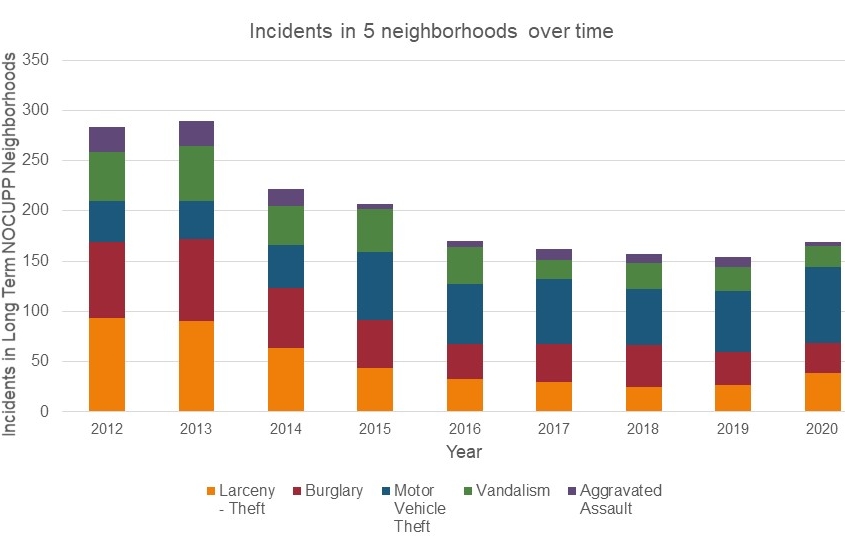
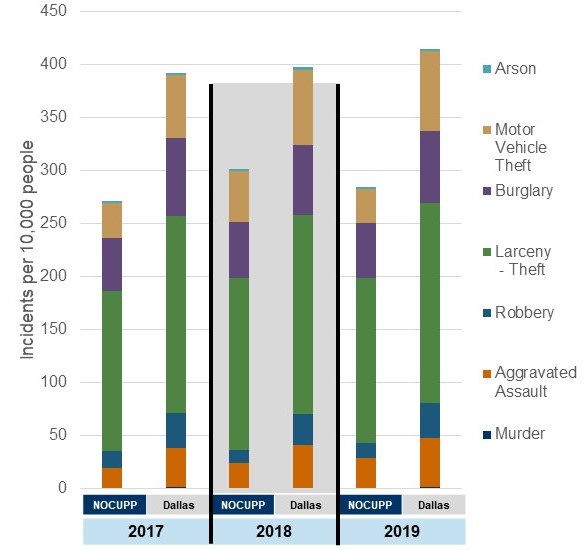
The success of what NOCUPP has done to reduce crime in our area can be seen quickly in how property crime has fallen since NOCUPP started. Overall crime has dropped by at least 50% in the neighborhoods patrolled by NOCUPP (burglaries down 70%, theft down 51%, vandalism down 42%, car theft down 60%). The neighborhoods just outside of our patrol area have actually seen some increases in crime during the same period, so the membership supported NOCUPP patrols most likely are the only reason crime has gone down in our neighborhoods.